


Abstract
Previous studies have demonstrated that SARS-CoV-2 is stable on surfaces for extended periods under indoor conditions. In the present study, simulated sunlight rapidly inactivated SARS-CoV-2 suspended in either simulated saliva or culture media and dried on stainless steel coupons. Ninety percent of infectious virus was inactivated every 6.8 minutes in simulated saliva and every 14.3 minutes in culture media when exposed to simulated sunlight representative of the summer solstice at 40°N latitude at sea level on a clear day. Significant inactivation also occurred, albeit at a slower rate, under lower simulated sunlight levels. The present study provides the first evidence that sunlight may rapidly inactivate SARS-CoV-2 on surfaces, suggesting that persistence, and subsequently exposure risk, may vary significantly between indoor and outdoor environments. Additionally, these data indicate that natural sunlight may be effective as a disinfectant for contaminated nonporous materials.
Coronavirus disease 2019 (COVID-19) was first identified in China in late 2019 and is caused by severe acute respiratory syndrome coronavirus 2 (SARS-CoV-2). As of late April 2020, the COVID-19 pandemic has resulted in over 2.4 million cases and 165 000 deaths worldwide. While uncertainty remains regarding transmission of SARS-CoV-2, recent evidence suggests that contact with contaminated fomites may play a significant role [1]. Several recent studies have reported the presence of SARS-CoV-2 genetic material on surfaces in patient rooms and other locations in hospital wards [2, 3]. Another recent study demonstrated that infectious SARS-CoV-2 could persist for multiple days on nonporous surfaces under indoor conditions (23°C, 40% relative humidity), with a maximum half-life approaching 7 hours [4]. Similarly, Chin et al [5] reported that infectious SARS-CoV-2 could be detected for days on nonporous surfaces under slightly different conditions (22°C, 65% relative humidity). While these studies demonstrated persistence of infectious virus on surfaces over extended periods, it should be recognized that only a single set of indoor conditions was investigated in each study. Previous studies with other viruses, including SARS-CoV-1, have demonstrated that survival in the environment is dependent on multiple factors, including temperature, humidity, sunlight, and the matrix in which the virus is suspended [6–11]. Therefore, the applicability of the data reported by van Doremalen et al [4] and Chin et al [5] to outdoor environments is uncertain and, to date, no other studies have investigated the role of these factors in the persistence of SARS-CoV-2 on surfaces. The objective of the present study was to evaluate the influence of simulated sunlight and suspension medium on the persistence of SARS-CoV-2 on surfaces and provide data needed to inform assessment of the exposure risk associated with contaminated outdoor surfaces.
METHODS
Cells
Vero cells (ATCC CCL-81) were cultured at 37°C and under 5% CO2 in complete growth medium (gMEM) consisting of minimum essential medium (Life Technologies) supplemented with 10% v/v heat-inactivated fetal bovine serum (Sigma Aldrich), 2 mM Glutamax (Life Technologies), 0.1 mM nonessential amino acids (Life Technologies), 1 mM sodium pyruvate (Life Technologies), and 1% v/v antibiotic-antimycotic solution (Life Technologies).
Virus
SARS-CoV-2 USA-WA1/2020 was obtained from BEI Resources (NR-52281; source, Centers for Disease Control and Prevention) as passage 4 material and passaged once in Vero cells to generate a passage 5 virus master stock. Virus master stock was then used to generate a passage 6 virus working stock that was used for all experiments in the present study. Confluent monolayers of Vero cells in T225 flasks were infected with virus master stock and allowed to adsorb for a period of 1 hour at 37°C and 5% CO2 with rocking every 15 minutes. After the adsorption period, additional culture medium was added and the flasks were returned to the incubator. At 72 hours post infection, the flasks were removed from the incubator, frozen at −80°C for at least 1 hour, thawed at 37°C, and the contents of the flasks clarified by centrifugation at 2000g for 10 minutes at 4°C. The clarified supernatant was concentrated approximately 10-fold using a 100 000 molecular weight cutoff cross flow cassette (VF20P4; Sartorius), then stored at −80°C in 1 mL aliquots until use.
The concentration of infectious virus was determined by microtitration assay in 96-well plates. Briefly, undiluted viral samples were loaded into 10 wells of 96-well, clear-bottom plates containing confluent monolayers of Vero cells, and serial 10-fold dilutions were performed. Plates were incubated at 37°C and 5% CO2. Visual inspection of plates for cytopathic effect was performed at 4 days post infection. Viral titers were estimated using the Spearman-Karber method [12, 13], and expressed as median tissue culture infectious dose (TCID50) per mL of sample. The concentrated virus was determined to be 1.5 × 10⁶ ± 7.5 × 10⁵ TCID50/mL (n = 15; mean ± standard deviation).
Coupon Exposure System
To allow introduction of simulated sunlight, an environmentally controlled chamber with a quartz window was used to irradiate coupons contaminated with dried virus (Figure 1). Coupons were attached to a mounting strip that could be attached to the interior wall of the chamber. A custom solar simulator (Sciencetech) consisting of a xenon arc lamp and a series of optical filters was used to illuminate the inside of the chamber with simulated sunlight (Figure 1) [14]. The light spectrum was designed to represent natural sunlight, specifically in the ultraviolet (UV) range (280–400 nm), and closely matched model spectra from the National Center for Atmospheric Research’s (NCAR) tropospheric ultraviolet and visible (TUV) radiation model in this range [15] (Figure 2). A previous study demonstrated that light in the UVA portion of the spectrum (315–400 nm) did not damage SARS-CoV-1 at doses similar to those used in the present study [16]. Therefore, the integrated irradiance in the UVB portion of the spectrum (280–315 nm) was utilized to quantify exposure. The intensity of the light was controlled through the use of neutral density filters and adjustment of the power supply to the lamp. Three different intensity levels, approximating integrated UVB irradiance levels for different times of day and year, were utilized in testing (Figure 2 and Figure 3). Spectra produced by the solar simulator were measured immediately outside of the chamber window using a spectroradiometer (OL756; Gooch & Housego) equipped with a 2-inch diameter integrating sphere light receptor (IS-270; Gooch & Housego), and corrected for transmission losses through the window. Representative spectra and comparisons to model spectra from NCAR’s TUV radiation model in the UVA and UVB ranges are shown in Figure 2 and Figure 3. A small amount of irradiance above background was also present in the 250–280-nm range of spectrum. The integrated amount was constant across the different UVA and UVB irradiance levels utilized and averaged 3.2 × 10⁻³ ± 7.5 × 10⁻⁵ W/m2.
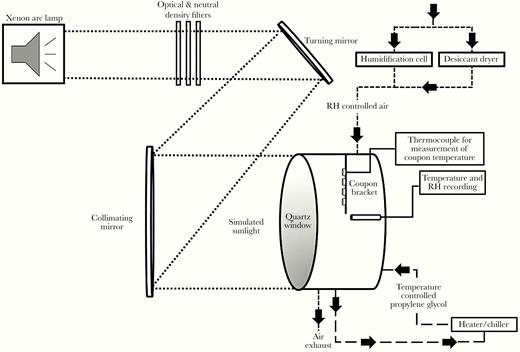
Schematic of the coupon exposure system. An environmentally controlled chamber with a quartz window to allow introduction of simulated sunlight was used to expose small coupons contaminated with dried SARS-CoV-2. Coupons were placed on mounting strip that attached to the interior wall of the chamber. A custom solar simulator consisting of a xenon arc lamp, a series of optical filters, and mirrors was used to illuminate the inside of the chamber with simulated sunlight. The temperature inside the chamber was maintained by circulating temperature-conditioned propylene glycol through the chamber walls. Relative humidity (RH) was maintained by supplying a low flow of humidity-controlled air through the chamber. The temperature and RH in the chamber and surface temperature of coupons were monitored continuously throughout the experiments.
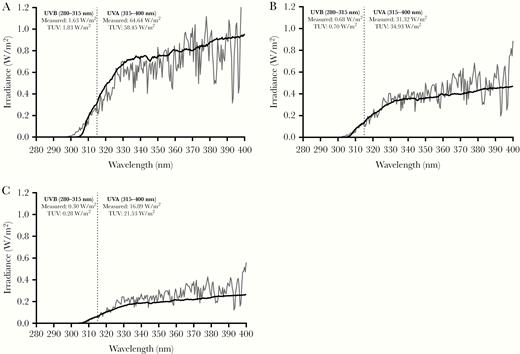
Representative spectra for simulated sunlight. Spectra utilized in the present study (black lines) and those predicted by the National Center for Atmospheric Research tropospheric ultraviolet and visible (TUV) radiation model (gray lines) for noon at 40°N latitude at sea level on (A) 21 June, (B) 21 February, and (C) 21 December are shown. Integrated irradiances for the UVA and UVB portions of the spectra for both the measured and TUV radiation model spectra are also shown and demonstrate good agreement between the measured and model spectra. The default settings for overhead ozone, surface albedo, clouds, and aerosols were utilized in the TUV radiation model estimates. Vertical dashed line at 315 nm denotes the boundary between UVA (315–400 nm) and UVB (280–315 nm).
Integrated UVB intensities for different times of day and year. Estimates of the integrated UVB irradiances are shown for different months and hours of the day at 40°N latitude and sea level (solid black lines). Horizontal dashed lines represent the integrated UVB irradiance levels for the spectra utilized in the present study and demonstrate that the spectra utilized span UVB irradiances expected throughout the year from the winter to summer solstices. Estimates of integrated UVB irradiance were generated using the National Center for Atmospheric Research tropospheric ultraviolet and visible radiation model run hourly for the 21st day of each month at sea level with default settings for overhead ozone, surface albedo, clouds, and aerosols.
The temperature and relative humidity inside the chamber were maintained within a narrow range for testing, specifically 20 ± 4°C and 19 ± 5%, respectively. The temperature and relative humidity control systems have been described previously [14]. Briefly, temperature inside the chamber was maintained by circulating temperature-conditioned propylene glycol through a series of channels in the chamber walls. Relative humidity in the chamber was maintained by supplying a low flow of humidity-controlled air through the chamber at 5 L/min. The conditions in the chamber were monitored continuously throughout the experiments using a calibrated temperature/relative humidity probe (HMP110; Vaisala). The surface temperature of coupons was measured by attaching a thermocouple (Type K Traceable Products) to a blank coupon mounted on the same suspending bracket as the virus-containing coupons.
Test Procedure
For each day of experiments, a frozen aliquot of concentrated virus was thawed and diluted 1:10 into either gMEM or a simulated saliva. The simulated saliva formulation represents a suspension medium that mimics the properties of saliva, specifically tonicity, pH, and protein content, and was similar to previously published recipes [17, 18] with the exceptions of KH2PO4 and K2HPO4, which were present at 15.4 mM and 24.6 mM. The pH was measured using a SevenExcellence pH meter (Mettler-Toledo). Percent solids were analyzed using a MA35 infrared moisture analyzer (Sartorius). To quantify protein content, a Pierce BCA Protein Assay Kit (Thermo Fisher Scientific) with an albumin standard curve was used and the assay was read on a SpectraMax M5 plate reader (Molecular Devices). For comparison, the physical properties of phosphate-buffered saline (Gibco pH 7.4, Thermo Fisher Scientific) were measured in parallel to the simulated saliva and gMEM.
Five 5-µL droplets of viral suspension were deposited onto 19-mm circular grade 304 stainless steel coupons (Diamond Perforated Metals) attached to a mounting bracket. The droplets were allowed to dry under ambient conditions outside of the chamber for 30 minutes prior to mounting. Conditions during drying averaged 24 ± 1°C and 29% ± 2% relative humidity and were measured with a portable hygrometer (4040CC; Traceable). Following mounting in the chamber, coupons were exposed to simulated sunlight for differing durations, ranging from 2 to 18 minutes, to allow estimation of the viral inactivation rate. A series of coupons were also exposed in the chamber without simulated sunlight for up to 60 minutes. Immediately following exposure, virus was recovered from coupons by submerging them into a tube containing 4 mL of gMEM and vortexing for 30 seconds. A minimum of 3 replicate coupons were assessed at each time point. Concentrations of infectious virus in recovered samples were assessed by microtitration assay in 96-well plates as described.
To ensure that material dried onto coupons was not being physically lost during the loading, exposure, and recovery processes, a series of experiments were performed with a physical tracer consisting of 0.1 μm fluorescent polystyrene beads (Thermo Fisher Scientific) diluted 1:10 into either gMEM or simulated saliva. Five 5-µL droplets of the fluorescent bead suspensions were deposited onto coupons. One subset of coupons was immediately recovered into collection media. The remainder were allowed to dry identically to those used in experiments with virus, and recovered either immediately after the drying period or after 60 minutes in the exposure chamber. The fluorescent tracer was recovered from coupons by submersion in purified water and vortexing for 30 seconds. Fluorescence intensity of the recovered sample was measured using a GloMax-Multi Jr Single-Tube Multimode Reader equipped with a blue fluorescence kit (Promega).
For each solar intensity, time-series log10 transformed viral concentration data from coupons were fit using linear regression in GraphPad Prism (Version 8.3.0), and the slope used as an estimate of viral inactivation rate, in log10 TCID50 lost per minute. Viral inactivation rates for the different simulated sunlight levels and suspension media were compared using 2-way analysis of variance (ANOVA) with a Sidak’s multiple comparisons test [19].
RESULTS
Concentrated SARS-CoV-2 was spiked 1:10 into either simulated saliva or gMEM prior to placement on the coupon and exposure to simulated sunlight. The addition of the viral concentrate to either simulated saliva or gMEM significantly increased the fractional solids and protein content of both media (Table 1).
Physical Properties of SARS-CoV-2 Virus Suspensions Used in Testing
| Property | Concentrated Viral Stock | Simulated Saliva | Simulated Saliva With Virus | gMEM | gMEM With Virus | PBS |
|---|---|---|---|---|---|---|
| pH | Not measured | 7.3 ± 0.0 | 7.4 ± 0.0 | 7.1 ± 0.0 | 7.4 ± 0.0 | 7.3 ± 0.0 |
| Percent solids (%) | 4.19 ± 0.46 | 1.01 ± 0.10 | 1.31 ± 0.03 | 1.53 ± 0.07 | 1.71 ± 0.03 | 1.09 ± 0.12 |
| Protein content (mg/mL) | 34.28 ± 0.90 | 0.68 ± 0 | 3.58 ± 0.07 | 4.46 ± 0.14 | 6.77 ± 0.03 | Not measured |
Abbreviations: gMEM, growth medium; PBS, phosphate-buffered saline.
NOTE: Values shown are arithmetic mean ± standard deviation.
Droplets were allowed to dry on coupons for 30 minutes. During this drying period, a small but significant decrease in the concentration of virus on the surface was noted when suspended in gMEM (3.1 ± 0.2 log10 TCID50/mL before vs 2.7 ± 0.3 log10 TCID50/mL after drying; P = .0018) but not simulated saliva (2.8 ± 0.1 log10 TCID50/mL before vs 3.0 ± 0.2 log10 TCID50/mL after drying; P = .1726).
Testing with a physical tracer spiked into both suspension media was used to quantify any physical losses occurring from the coupons during experimental processes. No significant differences in fluorescence were observed between the initial dry sample and the sample recovered after 60 minutes in the exposure chamber when compared using 2-way ANOVA (P = .068 and P = .500 for gMEM and simulated saliva, respectively), suggesting that no physical loss of material from coupons was occurring during the exposure and recovery processes.
Results showing SARS-CoV-2 inactivation as a function of integrated UVB irradiance are presented in Figure 4, Figure 5, and Figure 6.
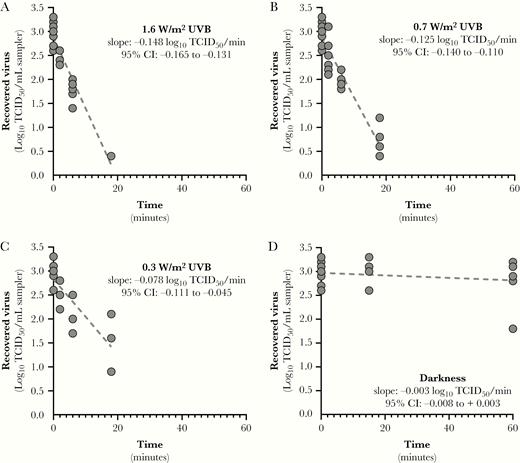
Inactivation rates for SARS-CoV-2 suspended in simulated saliva as a function of UVB irradiance. Linear regression fits for SARS-CoV-2 suspended in simulated saliva and recovered from stainless steel coupons following exposure to different light conditions are shown. Inactivation rates for exposure to any level of UVB irradiance were significantly faster than that observed in darkness (P < .0001). Additionally, the inactivation rates observed for UVB irradiances of 1.6 and 0.7 W/m2 were significantly greater than that observed for 0.3 W/m2 (P ≤ .0065). The slope of the regression line for darkness was not significantly different from zero. Goodness of fit parameters, specifically r2 and standard deviation of the residuals (RMSE), for each fit were: (A) r2 = 0.922, RMSE = 0.24; (B) r2 = 0.906, RMSE = 0.28; (C) r2 = 0.670, RMSE = 0.40; and (D) r2 = 0.041, RMSE = 0.32. Abbreviations: CI, confidence interval; TCID50, median tissue culture infectious dose.
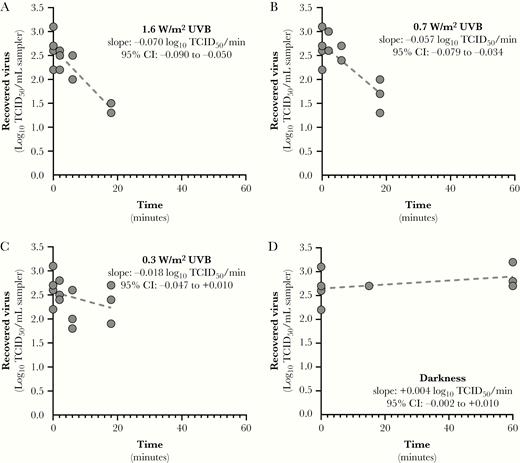
Inactivation rates for SARS-CoV-2 suspended in growth medium (gMEM) as a function of UVB level. Linear regression fits for SARS-CoV-2 suspended in gMEM and recovered from stainless steel coupons following exposure to different light conditions are shown. Inactivation rates for exposure to UVB irradiances of 1.6 and 0.7 W/m2 were significantly faster than that observed in darkness (P ≤ .0033). Inactivation rate for exposure to an irradiance of 0.3 W/m2 was significantly lower than that observed for an irradiance of 1.6 W/m2 (P = .014) but was not different from 0.7 W/m2 or darkness (P ≥ .227). The slopes of the regression lines for darkness and 0.3 W/m2 were not significantly different from zero. Goodness of fit parameters, specifically r2 and standard deviation of the residuals (RMSE), for each fit were: (A) r2 = 0.818, RMSE = 0.24; (B) r2 = 0.699, RMSE = 0.27; (C) r2 = 0.129, RMSE = 0.35; and (D) r2 = 0.236, RMSE = 0.24. Abbreviations: CI, confidence interval; TCID50, median tissue culture infectious dose.
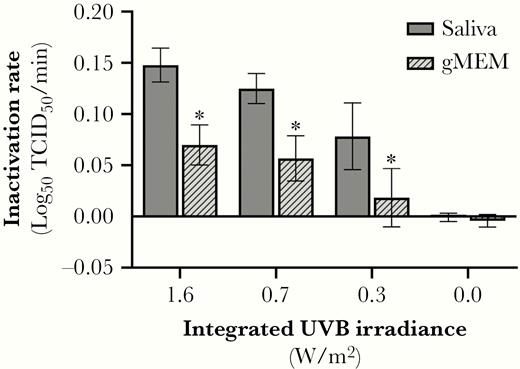
SARS-CoV-2 inactivation rates as a function of UVB level. Inactivation of SARS-CoV-2 on stainless steel coupons was significantly greater in the presence of simulated sunlight than that observed in darkness. The UVB level and the suspension matrix both significantly affected the measured inactivation rate. * P < .05 when compared to saliva at the same UVB irradiance level. Values are best fit slopes from linear regression with associated 95% confidence intervals. Abbreviations: gMEM, growth medium; TCID50, median tissue culture infectious dose.
Linear regression fits for SARS-CoV-2 suspended in either simulated saliva or gMEM and recovered from stainless steel coupons following exposure to different light conditions are shown in Figure 4 and Figure 5. For virus suspended in simulated saliva, inactivation rates for exposure to any level of UVB irradiance were significantly faster than that observed in darkness (P < .0001; Figure 4). Additionally, the inactivation rates observed for UVB irradiances of 1.6 and 0.7 W/m2 were significantly greater than that observed for 0.3 W/m2 (P ≤ .0065). There was not a significant loss of infectivity in darkness over the duration of the exposure period (P = .585), and the slope of the regression line was not significantly different from zero.
For virus suspended in gMEM, inactivation rates for exposure to UVB irradiances of 1.6 and 0.7 W/m2 were significantly faster than those observed in darkness (P ≤ .0033; Figure 5). Inactivation rates for exposure to an irradiance of 0.3 W/m2 were significantly lower than that observed for an irradiance of 1.6 W/m2 (P = .014) but were not different from 0.7 W/m2 or darkness (P ≥ .227). There was not a significant loss of infectivity in darkness over the duration of the exposure period (P = .370), and the slope of the regression line was not significantly different from zero.
The results of 2-way ANOVA analysis demonstrated that both UVB irradiance and the suspension matrix significantly affected the inactivation rate. Inactivation rates in simulated saliva ranged from near zero in darkness to 0.15 log10 TCID50 loss/min (95% confidence interval [CI], .13–.16) at maximum UVB. Ninety percent of infectious virus would be lost every 6.8, 8.0, and 12.8 minutes for integrated UVB irradiances of 1.6, 0.7, and 0.3 W/m2, respectively. Inactivation rates in gMEM ranged from near zero in darkness to 0.07 log10 TCID50 loss/min (95% CI, .05–.09) at maximum UVB. Ninety percent of infectious virus would be lost every 14.3 and 17.6 minutes for integrated UVB irradiances of 1.6 and 0.7 W/m2, respectively. At all levels of UVB irradiance, the inactivation rate of virus was greater when suspended in simulated saliva than gMEM (P < .0001; Figure 6).
DISCUSSION
It has been demonstrated previously that UVC light, which is not present in natural sunlight, can inactivate coronaviruses [15]. The present study is the first to demonstrate that UVB levels representative of natural sunlight rapidly inactivate SARS-CoV-2 on surfaces, specifically virus dried on stainless steel coupons. The results also show that the inactivation rate is dependent on both the intensity of simulated sunlight and the matrix in which the virus is suspended. Under levels of simulated sunlight representative of midday on the summer solstice at 40°N latitude, 90% of infectious virus is inactivated every 6.8 minutes in simulated saliva dried on a surface. For simulated sunlight representative of the winter solstice at 40°N latitude, 90% of infectious virus is inactivated every 14.3 minutes in simulated saliva dried on a surface. These findings suggest that the potential for fomite transmission may be significantly reduced in outdoor environments exposed to direct sunlight relative to indoor environments. Additionally, these data provide evidence that natural sunlight may be effective as a disinfectant for contaminated nonporous materials. However, while significant levels of viral inactivation were observed within minutes at all simulated sunlight levels investigated, it should be noted that the duration of time each day that outdoor UVB levels exceed those used in the present study is dependent not only on the time of year, but also on the local weather conditions, especially cloud cover. Thus, it is possible that significant day-to-day variability may exist in the persistence of SARS-CoV-2 on surfaces in outdoor environments.
In contrast to simulated sunlight, no significant decay was observed in darkness over the 60-minute test duration, which is consistent with previously published data with both SARS-CoV-2 and SARS-CoV-1 [4, 5, 9, 20]. van Doremalen et al [4] reported half-lives of 5.6 and 6.8 hours for SARS-CoV-2 on nonporous stainless steel and plastic surfaces, respectively, under indoor conditions, or approximately 18 to 23 hours for a 90% reduction in infectivity. Chan et al [9] reported that it took 3–5 days to lose 90% of infectivity of SARS-CoV-1 dried on a surface under indoor conditions. Given these reported decay rates, it would not be expected that a measurable decrease in viral infectivity would be observable after 1 hour in darkness in the present study. One variable among the present study and these previous studies was the size of the droplet used to contaminate the surface. In the present study, 5-µL droplets were used, whereas previous studies used droplet sizes ranging from 5 µL up to 500 µL. It is known that a range of droplet sizes are present in respiratory expulsion events and, therefore, a range of droplet sizes are relevant to studies examining the persistence of virus-laden droplets on surfaces [21, 22]. However, there is evidence that the size of a droplet may affect the subsequent survival of viruses contained within the droplet following deposition on a surface [23], potentially complicating comparisons of the results between studies in which different droplet sizes were used. Therefore, additional studies examining the relationship between droplet size and surface persistence are needed to better understand the impact of this parameter on the hazard posed by surface contamination.
The results of the present study also demonstrate that the inactivation rate of SARS-CoV-2 in simulated sunlight was approximately 2-fold greater in simulated saliva than in culture media. However, no significant decay was observed in darkness for either suspension medium over the duration of the test. These results suggest either that some component of the culture medium protects the virus from direct photoinactivation, which has been shown previously for SARS-CoV-1 when albumin was present [24] or that a chromophore present in simulated saliva is involved in indirect photoinactivation of virus through production of a toxic intermediate [25], although additional testing is needed to better elucidate this mechanism. While no effect of suspension medium was observed in darkness in the present study, a previous study found that the addition of 10% fetal calf serum to culture media enhanced the surface persistence of SARS-CoV-1 in dried droplets under indoor conditions [20]. Given the slow decay rates previously reported under indoor conditions, it is possible that the duration of the tests in the present study were not sufficient to discern any small differences in inactivation rate due to suspension medium that may exist in darkness.
The simulated saliva used in this study generally mimics the properties of human saliva and was similar to recipes reported in other studies [17, 18, 26]. However, the need to concentrate the viral stock in order to achieve measurable concentrations on surfaces resulted in a significant shift in the properties of the simulated saliva upon addition of the virus, specifically increases in the protein concentration and fractional solids. Thus, while the results of the present study demonstrate that suspension medium can significantly affect persistence under simulated sunlight, it is unclear if the viral concentrate diluted in simulated saliva is representative of contaminated saliva from an infected individual. Additional testing, including compositional analysis of fluid samples from infected individuals, is needed to better understand the role of suspension medium in the environmental persistence of SARS-CoV-2.
Finally, while the simulated sunlight spectra utilized in the present study were meant to be representative of natural sunlight at different times of the year, a low level of irradiance was present below the UVB portion of the spectrum, between 250 and 280 nm, that is not present outdoors. The integrated irradiance in this range was approximately 3 × 10⁻³ W/m2, which is 100–500 times lower than the integrated UVB irradiances utilized in the present study. A previous study demonstrated that 254-nm UVC light rapidly inactivated SARS-CoV-1 [16]. However, this study only looked at a single irradiance level and the associated doses were more than 1000-fold greater than those in the 250–280 nm region in the present study, making it difficult to determine if the low level of irradiance in the present study contributed to the measured inactivation rates. Beck et al [27] examined the effect of narrow bands of UV radiation ranging from 210 nm up to 290 nm on inactivation of MS2 phage, a single-stranded RNA virus. The results of this study demonstrate that doses of UV in the 260–280-nm range equivalent to those in the present study would not be expected to result in significant inactivation of MS2, while doses of UVB equivalent to those in the present study would be expected to produce an approximately 1000-fold decrease in viral infectivity. While this suggests that the low level of UV irradiance measured in the 250–280-nm range in the present study is not likely to have contributed significantly to the measured inactivation rate, additional studies examining the inactivation of SARS-CoV-2 as a function of wavelength, and comparing inactivation rates measured with a solar simulator and under natural sunlight, potentially with a surrogate microorganism, would be informative.
The present study provides the first evidence that sunlight may rapidly inactivate SARS-CoV-2 on surfaces, suggesting that surface persistence, and subsequently exposure risk, may vary significantly between indoor and outdoor environments. However, in order to fully assess the risk of exposure in outdoor environments, information on the viral load present on surfaces, the transfer efficiency of virus from those surfaces upon contact, and the amount of virus needed to cause infection are also needed.
Notes
Acknowledgments. The authors thank the Johns Hopkins University Applied Physics Laboratory for their expert technical guidance in development of the chamber and solar simulator utilized in this study.
Disclaimer. The views and conclusions contained in this document are those of the authors and should not be interpreted as necessarily representing the official policies, either expressed or implied, of Department of Homeland Security (DHS) or the US Government. The DHS does not endorse any products or commercial services mentioned in this presentation. In no event shall the DHS, Battelle National Biodefense Institute, or National Biodefense Analysis and Countermeasures Center have any responsibility or liability for any use, misuse, inability to use, or reliance upon the information contained herein. In addition, no warranty of fitness for a particular purpose, merchantability, accuracy, or adequacy is provided regarding the contents of this document.
Financial support. This work was supported by the DHS Science and Technology Directorate (under agreement number HSHQDC-15-C-00064) awarded to Battelle National Biodefense Institute for the management and operation of the National Biodefense Analysis and Countermeasures Center, a Federally Funded Research and Development Center.
Potential conflicts of interest. All authors: No reported conflicts of interest. The authors have submitted the ICMJE Form for Disclosure of Potential Conflicts of Interest. Conflicts that the editors consider relevant to the content of the manuscript have been disclosed.

